Data collection and processing
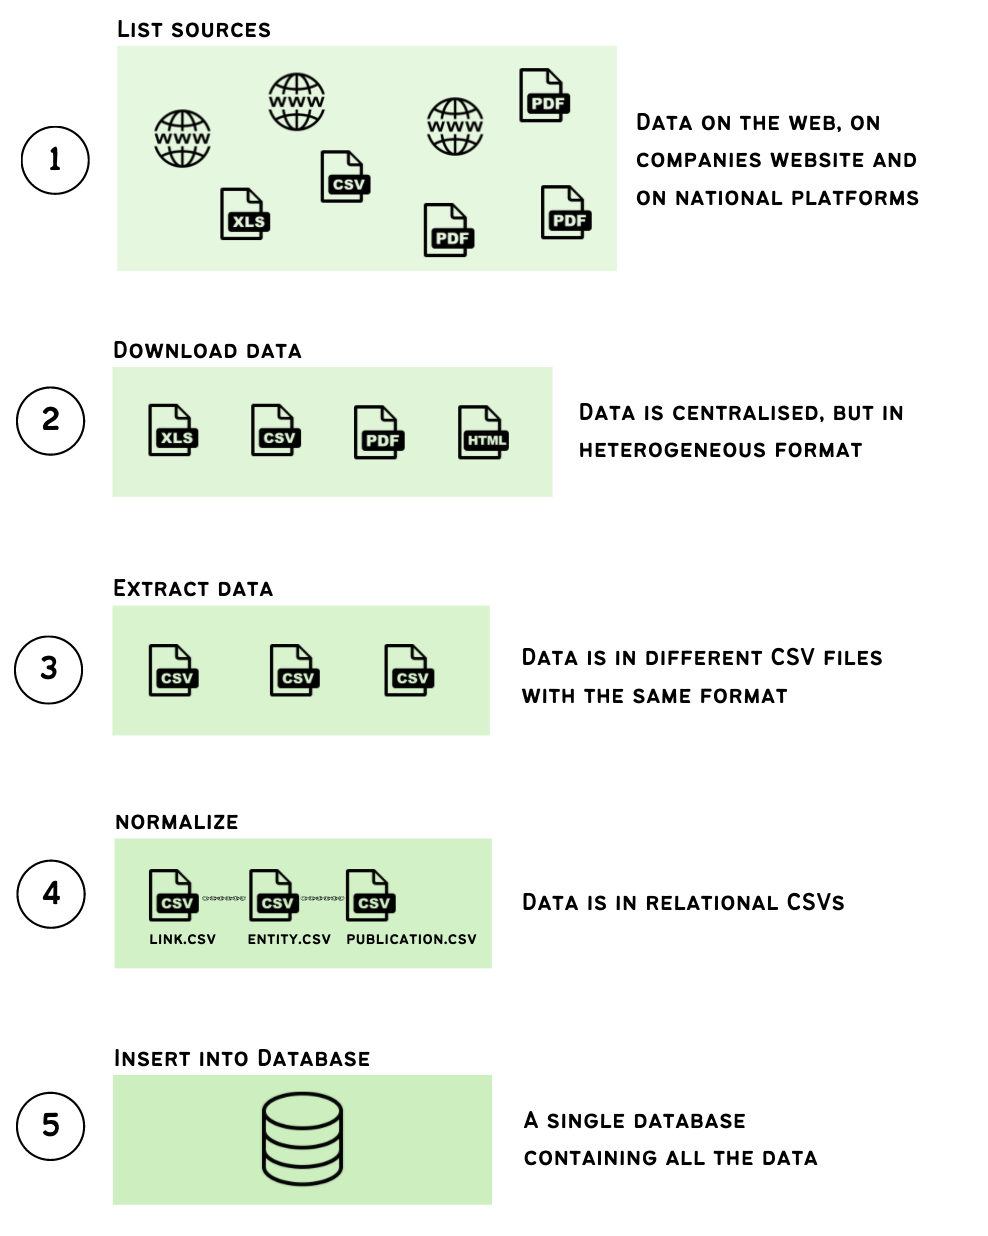
1 – Listing Sources
For centralized countries, this is simple. For countries based on PDFs, we list the PDFs in an online spreadsheet.
Here you can see the sources we used for centralized countries as well as links to the list of PDFs we gathered for PDF countries:
| Country | Source(s) used |
|---|---|
| France | Base Transparence Santé (public register) |
| Portugal | Infarmed (public register) |
| Denmark | Danish Medicines Agency (public register) |
| Belgium | beTransparent (public register) |
| Romania | ANM (public register) |
| United Kingdom | Disclosure UK, made by the ABPI (trade association) |
| Ireland | transferofvalue.ie, made by the IPHA (trade association) |
| Sweden | Documents disclosed by each company: see list |
| Germany | Documents disclosed by each company: see list |
| Spain | Documents disclosed by each company: see list |
| Italy | Documents disclosed by each company: see list |
| Switzerland | Documents disclosed by each company: see list |
2 – Download data
For centralized countries, we download the data if possible (UK), or scrape the website. For PDF countries, a Python script reads the previous spreadsheet and downloads the pdfs, standardizing names for practicality.
3 – Extract data
For centralized countries, we read the downloaded files (xls or html files), and extract the data via a python script, then save the data as a csv file.
For PDF countries, this is much more complex. We tried various approaches, the best results were obtained via first using softwares to convert the PDF into XLS, then extract the data from the Excel file. Due to the versatility of the PDF documents, no converter was working for all documents, so we used different converters, so we possibly had different xls files for each pdf file. Converters used: Adobe Acrobat Export PDF, SmallPDF, ABBYY Finereader
Even once in Excel format, extracting data wasn’t trivial, since each company formatted their publication differently. The main challenges were to correctly identify columns and the different blocks of lines of each documents (Headers, HCP individual lines, HCP aggregated lines, HCO individual lines, HCO aggregated lines, RnD line)
The result of this step is a csv file representing the data in a format very close to the EFPIA format.
For PDF countries, this step was sometimes unsuccessful, you can see the parse ratio on the overview dashboard.
4 – Normalize
We developed a format to represent links of interest in a standardized way (see details of this format here on gitlab). This format can represent both the EFPIA standard as well as other standards of countries with state regulation like France or Portugal. In this step we convert the previous CSV files to this format.
5 – Insert into database
Once the data is in a normalized CSV file, it can be inserted into a unique database. This database sits on a server with an instance of Metabase, an open-source tool for database exploration (see here for more info). This tool allows to run SQL queries against the database as well as to create charts and dashboards.
Quality checks
The goal of this project is to collect and centralize data without altering it. To ensure this we put various quality checks in place, especially around the extraction of the data from EFPIA PDF publication:
- Checking which line blocks were detected in the file (some line blocks can be empty or not be present, but not all)
- HCP lines cannot have Grants or Event Sponsorship values
- Each line must have a least a value
- If an aggregated line is detected, the 2 other aggregated lines must be detected (amount, percent, number of recipients)
We also did some manual checks, like:
- Randomly checked 100 links of interest against their source and found no data had been misread.
- Checked the links with the biggest values to check against their source
We then extracted key metrics grouped by year / company / country for the top 20 companies in term of total amount disclosed. We manually checked these metrics.
The nature of the format we created is thought to allow quick verification against the source where the data was first published. Especially in the “main” table enhanced_link, there is the url of the source of the data, allowing for quick verification.
Should you encounter any mistake in the data, please contact us immediately, we will do our best to fix it.
Gitlab repository
Our project is open source, the code is available in this gitlab repository. This repo contains the code that processes the data, but not the data itself. If you’re interested in accessing our data, please see here.